 For the last few CES shows, we’ve been strapping on as many fitness trackers as would fit on our wrists, hitting the floors and conference rooms, and comparing results. We don’t expect accuracy — we don’t do a manual count of steps — but we hope for a degree of consistency. When we first did this three years ago, trackers showed error of more than 35 percent, which meant the data they were generating was essentially worthless. This year, results are far better.
We collected five data points a day for five days: from the Apple Watch’s Activity app, the iPhone 6’s Health app, a Fitbit Charge 2, a Garmin Fenix 3HR, and a Samsung Gear 2. The Watch and the Fitbit were on the left wrist, the Garmin and the Gear were on the right. The phone was in one pocket or another or in our hand. We couldn’t get the Garmin to work until the beginning of Day 3, and the Day 3 figures are probably a couple of hundred steps low because the device wouldn’t sync and start counting until it had been in motion outdoors for several minutes.
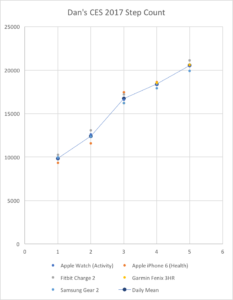
The graph of the results appears above, and the full data set follows.
All five devices generally agreed with each other, deviating daily between 1.5 and 5 percent. Even that 5 percent figure is an outlier; the next-highest daily standard deviation was 3.9 percent. Interestingly, the more steps the devices counted, the closer the fit was.
Over the five days, some patterns did emerge. Apple’s Health app — the one from the iPhone — was the least consistent, reading significantly higher or lower than the mean for three out of five days. The Fitbit Charge 2 consistently read one standard deviation higher than the mean. The Samsung Gear Fit 2 tended to read a little low, sometimes by an entire standard deviation. But the Apple Watch and the Garmin Fenix 3HR were consistently very tight to the five-device average, particularly when you take into account the Garmin’s first-day undercount.
There was no correlation between which wrist a device was on and its tightness to the mean.
Again, this isn’t a measure of accuracy, although the numbers are consistent enough that they’re highly informative and believable. The fact that five devices from four different vendors are in such substantial agreement may well be good enough for most purposes.
The full data set follows. Yes, our legs still hurt.
| Day 1 | Day 2 | Day 3 | Day 4 | Day 5 | |
| Apple Watch (Activity) | 9822 | 12606 | 16611 | 18349 | 20437 |
| Apple iPhone 6 (Health) | 9341 | 11593 | 17476 | 18629 | 20590 |
| Fitbit Charge 2 | 10250 | 13088 | 17218 | 18494 | 21137 |
| Garmin Fenix 3HR | 16218 | 18574 | 20630 | ||
| Samsung Gear Fit 2 | 9988 | 12360 | 16211 | 17941 | 19915 |
| Daily Mean | 9,850 | 12412 | 16747 | 18397 | 20542 |
| Std. Deviation | 382 | 624 | 579 | 276 | 438 |
| Std Dev Pct | 3.88% | 5.03% | 3.45% | 1.50% | 2.13% |
For more coverage of CES 2017, click on the CES2017 tag.